90% of all the data in the world today has been created in the past few years. According to IBM, 2.5 exabytes (2.5 billion GB) of data was generated every day in 2012.
Nowadays it is quite easy to acquire significant amounts of data, the hardest part though is to manage and extract valuable information from it. The real challenge is moving from row data to intelligence and turning information into knowledge.
Connected objects were about 5 billion in 2016, and they may well reach up to 20 billion within the next five years. Each and everyone of these tools can receive and send an amount of data that only a few years ago would have been simply unimaginable.
People such as managers and decision-makers are constantly in search of new data. They want to make sure they understand customers and users. They need more information to use in their decision-making process. However, this is a common mistake. People think they need more information, whereas what they actually need is more knowledge.
According to Nate Silver, author of Signal versus Noise.
The signal is the truth. The noise is what distracts us from the truth.
In a world with ever-increasing amounts of data, it is far from easy to tell the signal from the noise. That’s a process that needs significant expertise and cooperation between humans and technologies such as machine-learning and artificial intelligence.
Data analysis process can be divided into four levels, starting from a standard analysis that can only provide information on a given event, all the way to prescriptive analysis capable of anticipating future actions.
Level 1. Descriptive — What happened?
Data can tell us what happened, but not why it happened. Sensors can grab data from the real world and describe the scenario before, during and after a particular event. For instance, every car has some CPU’s that can capture data from hundreds of sensors in order to describe engine status. The result could be an alert on the car dashboard, inviting the driver to stop.
Level 2. Diagnostic — Why did it happen?
Intelligent systems can match information and understand why something happened. Computers can figure out what caused a structural failure in a building, just like airplane sensors can describe vehicle status and provide information on why something went wrong. Unfortunately, this type of analysis is not preventive. That’s why a more profound understanding is fundamental in order to come up with better products.
Level 3. Predictive — What will happen?
The next step is moving from description to prediction, basically to look into the future. Algorithms can get data analysis and make tangible assumptions about the future, such as upcoming stock markets moves. The majority of stock exchanges are regulated by computers that, according to market movements, can autonomously buy or sell stocks.
Level 4. Prescriptive — How can make it happen?
Prescriptive is the last level as well as the most challenging one. Intelligent systems describe what happened, explain causes, look into the future and understand how to create outcomes. Vertical farm, with a broad network of sensors and artificial intelligence, can create the best environment for indoor culture and create perfect and tasty greens without chemical additives.
Moving from description to prescription is an important step towards adding value to information.
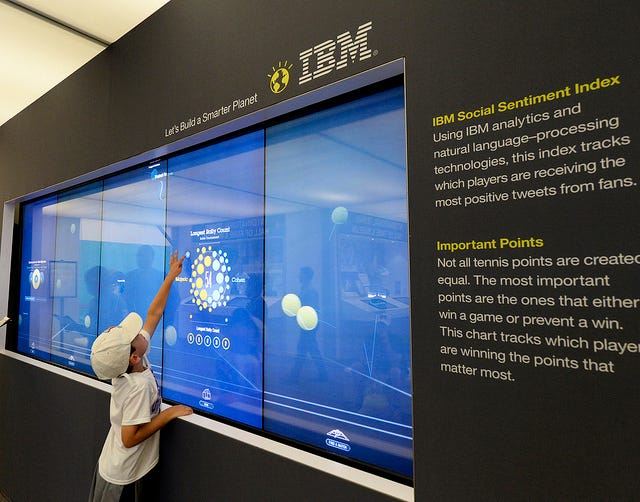
The value obtained from data can be used by several stakeholders, as proved by the recent IBM project during USOpen.
IBM designers and engineers set up a complex system of sensors, cameras, and AI software. The system was able to analyze a match and extract video clips of the most exciting moments. That’s possible thanks to the analysis of athletes’ movements, body reactions and audience noise. The same technology is useful for athletes aiming at improving their techniques.
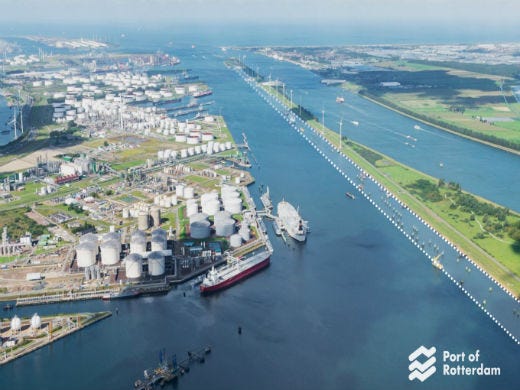
Another good example is the transformation of the Rotterdam port, the biggest European port. IBM systems can analyze movements and forecast naval traffic, optimizing boarding procedures and loading management. This is possibile thanks to a deep network of IoT sensors, Artificial Intelligence and smart weather data. Shipping companies can now figure out the best time and conditions to hit the shores of Rotterdam.
The two case studies from IBM show amazing results. Both of them started sharing a common element: an excellent orchestrion of sensors and artificial intelligence. Every person involved in the design process needs to understand data and Ai, in order to create better products and services and to provide higher quality experiences.